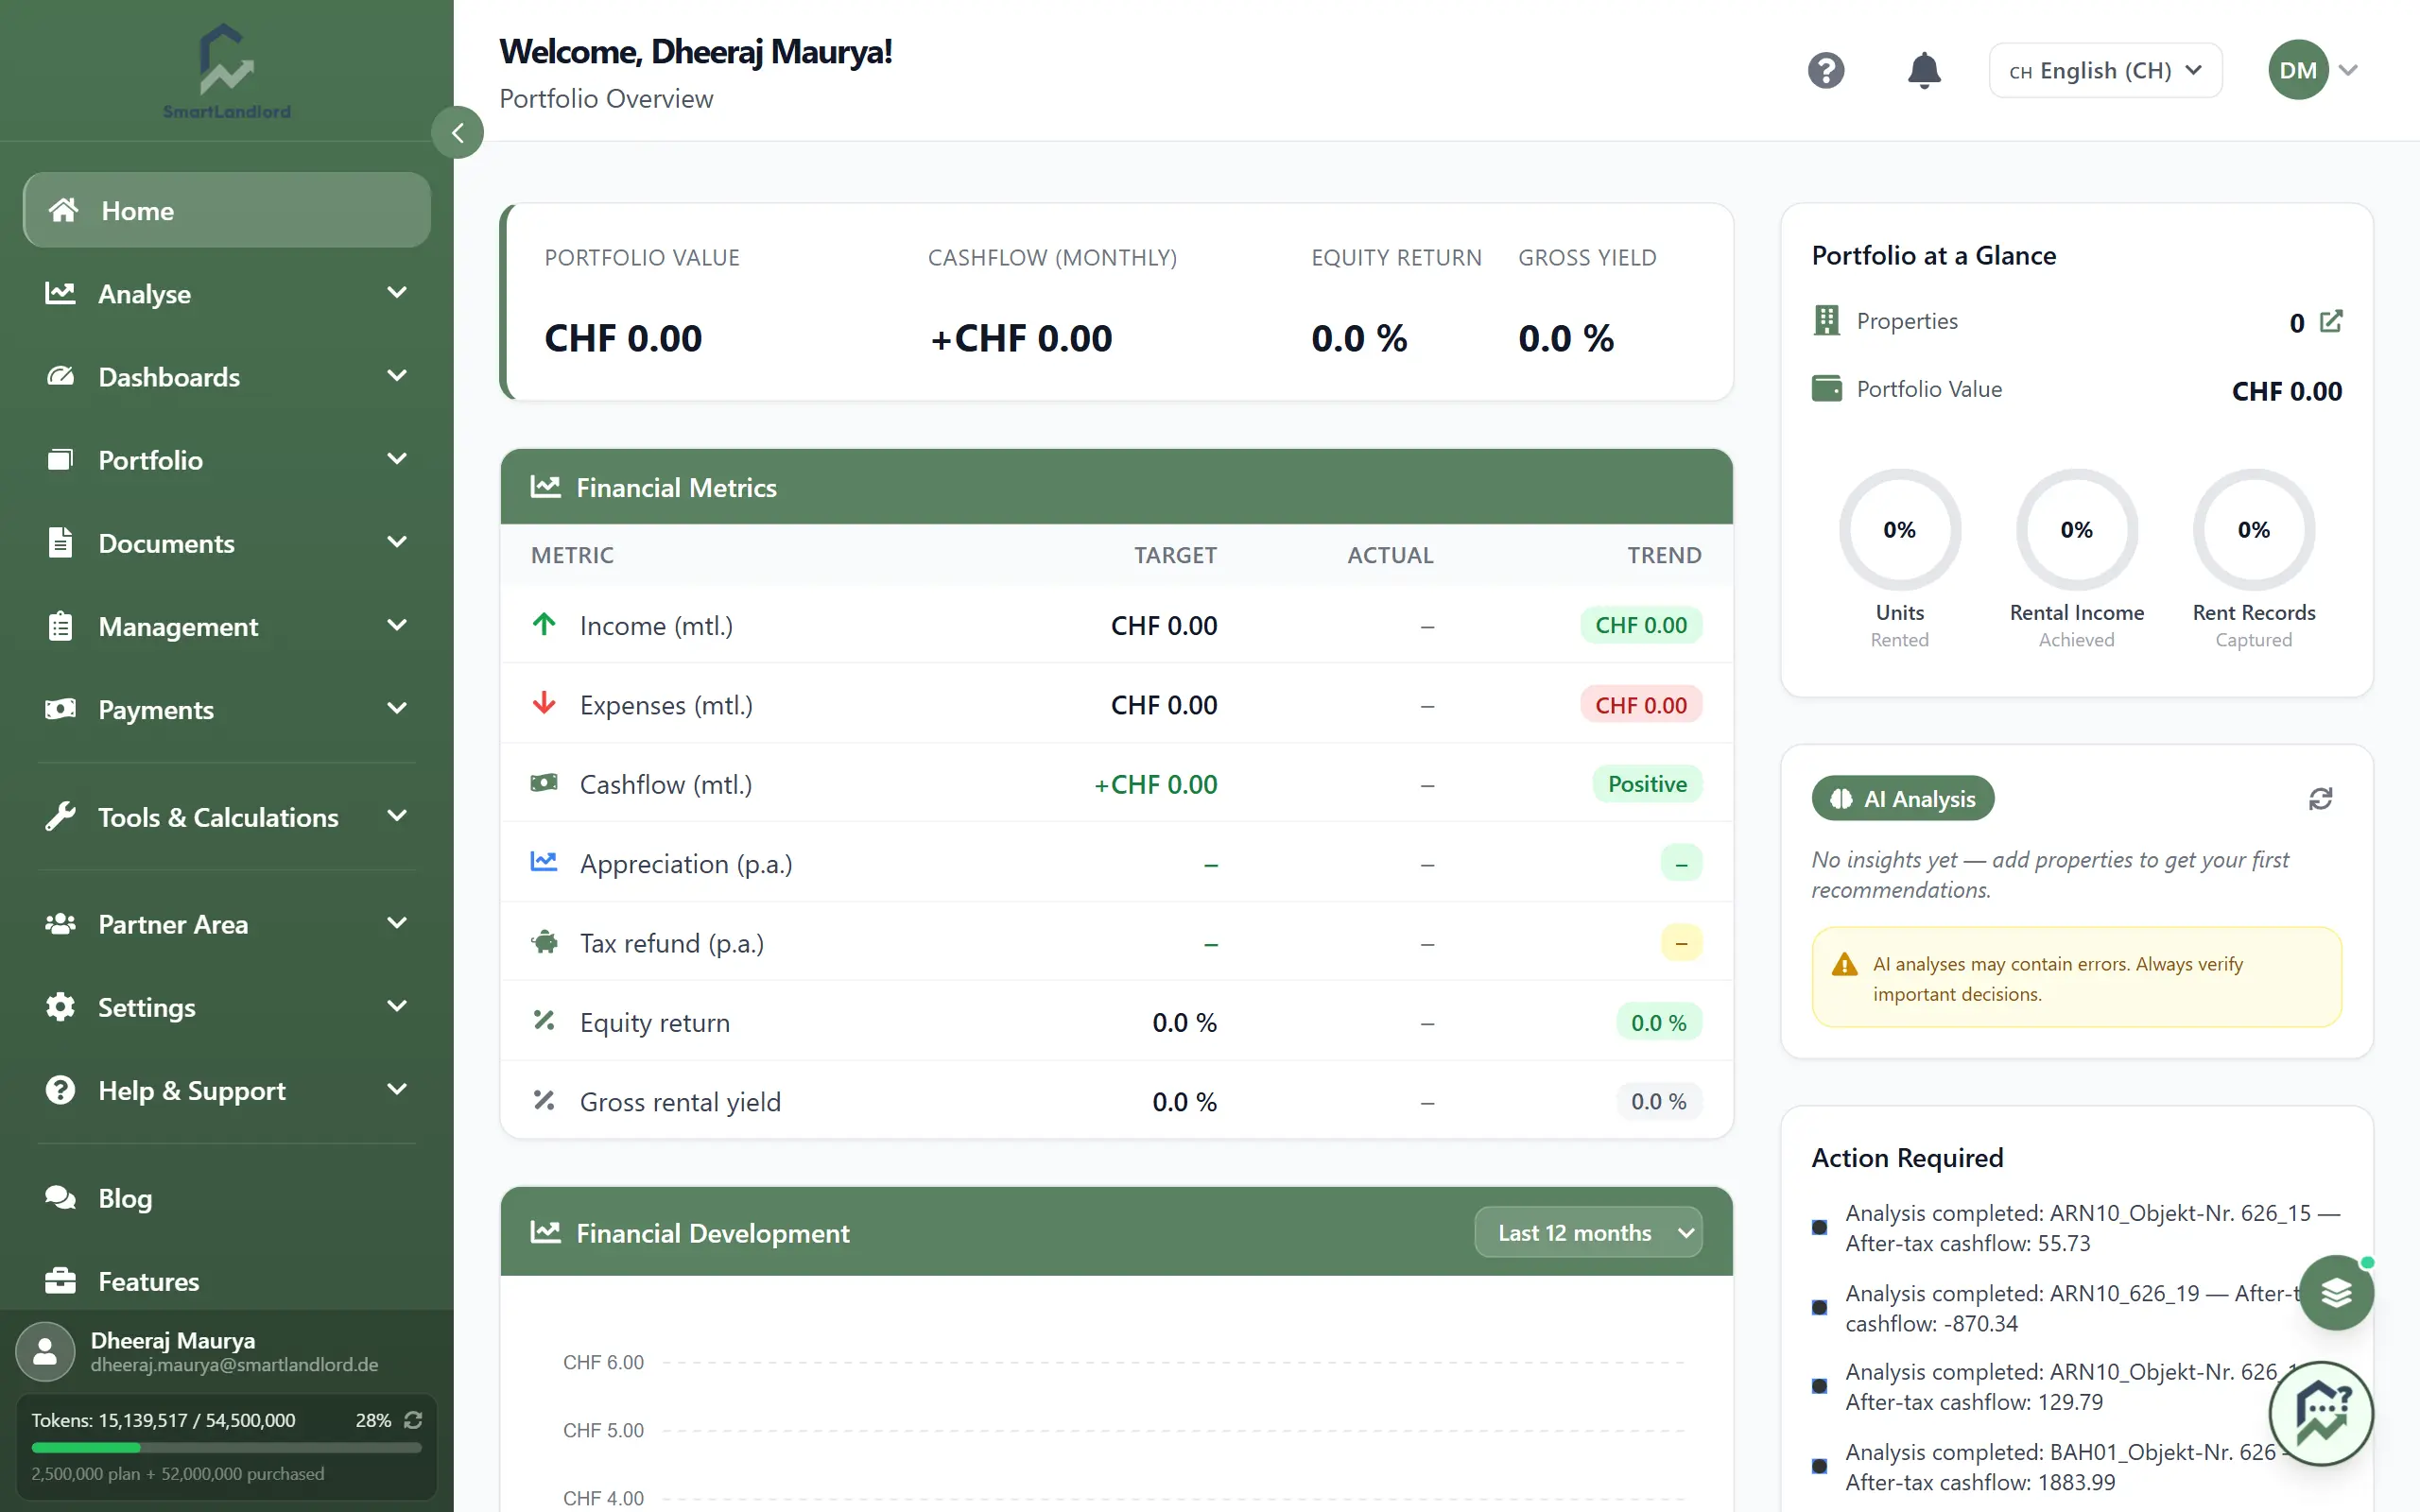
Home Dashboard — Your Property Portfolio at a Glance
The Home page is your portfolio at a glance – the first screen you see after you sign in to SmartLandlord. It pulls together key numbers, trends, maps, and tasks so you always know how your portfolio is doing and what needs your attention.
Use the Home page as your daily control centre. It provides a summary of information from across SmartLandlord and helps you identify areas that may require attention.
1. What you see
On the Home page you usually see these areas:
- Portfoliooverzicht – your key numbers (portfolio value, cashflow, yield, return).
- Financiële statistieken – how income and expenses develop over time.
- Financiële ontwikkeling – how portfolio value, equity, and returns change over time.
- Uw eigenschappen – your properties on a map.
- AI-analyse – AI insights based on your data.
- Actie vereist – items that need your attention.
Sections may be stacked or side-by-side depending on your screen size, but the content is the same.
2. Portfoliooverzicht
The portfolio overview shows the main health indicators of your portfolio in a few cards.
Typical cards:
- Portfoliowaarde – total estimated value of your active properties.
- Cashflow (maandelijks) – net cashflow for the selected period (income minus expenses).
- Bruto-opbrengstpercentage – gross or net yield as a percentage.
- Rendement op eigen vermogen – overall return for the selected period.
How to use it:
- Adjust the time range (for example, month vs year) if a filter is available.
- Use info tooltips to understand how each metric is calculated.
- Click a card (where enabled) to open the related detailed report.
If portfolio values, cashflow, yield, or return appear incorrect, review the underlying property, financing, tenant, and payment information before making decisions.
3. Financial metrics and development
Financiële statistieken and Financiële ontwikkeling
These sections show how your portfolio behaves over time, not just at one point.
Financiële statistieken
Focus: income and expenses.
You typically see:
- A chart of income (rent and other income) per period.
- A chart of expenses (operating costs, maintenance, etc.).
- A Netto kasstroom line or bars.
Use it to:
- Spot months with unusually high costs or low income.
- See whether your cashflow is trending up or down.
- Hover over points or bars to see exact values.
Financiële ontwikkeling
Focus: long-term portfolio progress.
You typically see:
- Portfoliowaarde over time.
- Eigen vermogen over time (value minus loans).
- Rendement op eigen vermogen or performance curves.
Use it to:
- Compare different years or periods.
- Understand how purchases, sales, or refinancing affect your equity and returns.
- Check that your portfolio is moving towards your goals.
4. Uw eigenschappen
The properties map shows where your properties are located and how they are spread across regions.
On the map you can typically:
- Pan and zoom to focus on specific cities or areas.
- Click a marker to see a quick property summary.
- Use filters (if available) to show only certain property types or statuses.
Use the map to:
- See geographic concentration and diversification.
- Plan visits and inspections.
- Combine with AI or financial views when location matters.
5. AI-analyse
The AI analysis area surfaces insights and patterns from your portfolio data.
Examples of insights:
- Properties with unusually high or low yield.
- Tenants or leases that may be at risk (for example, arrears patterns).
- Cost spikes or unusual trends in specific buildings or regions.
How to use it:
- Read through the insights to see what the system considers important today.
- Click an insight to open the related property, tenant, or report.
- Treat AI as a guide, not as a decision maker – always sanity-check results.
AI can make mistakes. Use AI insights to focus your attention, but always verify information before making financial, legal, or investment decisions.
6. Actie vereist
The Action required panel is your to-do list for the portfolio.
Typical items:
- Overdue or upcoming rent payments.
- Expiring leases or contracts.
- Tasks such as maintenance or inspections.
How to use it:
- Start your day by scanning this list.
- Click each item to open its detail page and resolve it.
- Once you complete an item, update its status so it disappears from this list.
Review this section regularly. Missing overdue payments, expiring leases, or maintenance tasks can have financial and operational consequences.
7. Daily workflow example
A simple way to use the Home page every day:
1. Check the Portfoliooverzicht to see if your key numbers look right.
2. Glance at financial metrics and development for any unusual trends.
3. Go through Actie vereist and complete the most urgent items.
4. Review AI-analyse for extra insights and follow up where needed.
5. Use the properties map when planning location-related work.
If something you expect is missing (for example, a section or metric), check your permissions or plan, or contact support.
Keeping information current
Many Home page metrics are generated using data from across SmartLandlord.
The accuracy of the Home page depends on keeping property, tenant, financing, payment, and analysis data up to date throughout the platform.
Outdated information can affect portfolio metrics, dashboards, AI insights, and action items.