Energy Dashboard — Monitor Energy Performance Across Properties
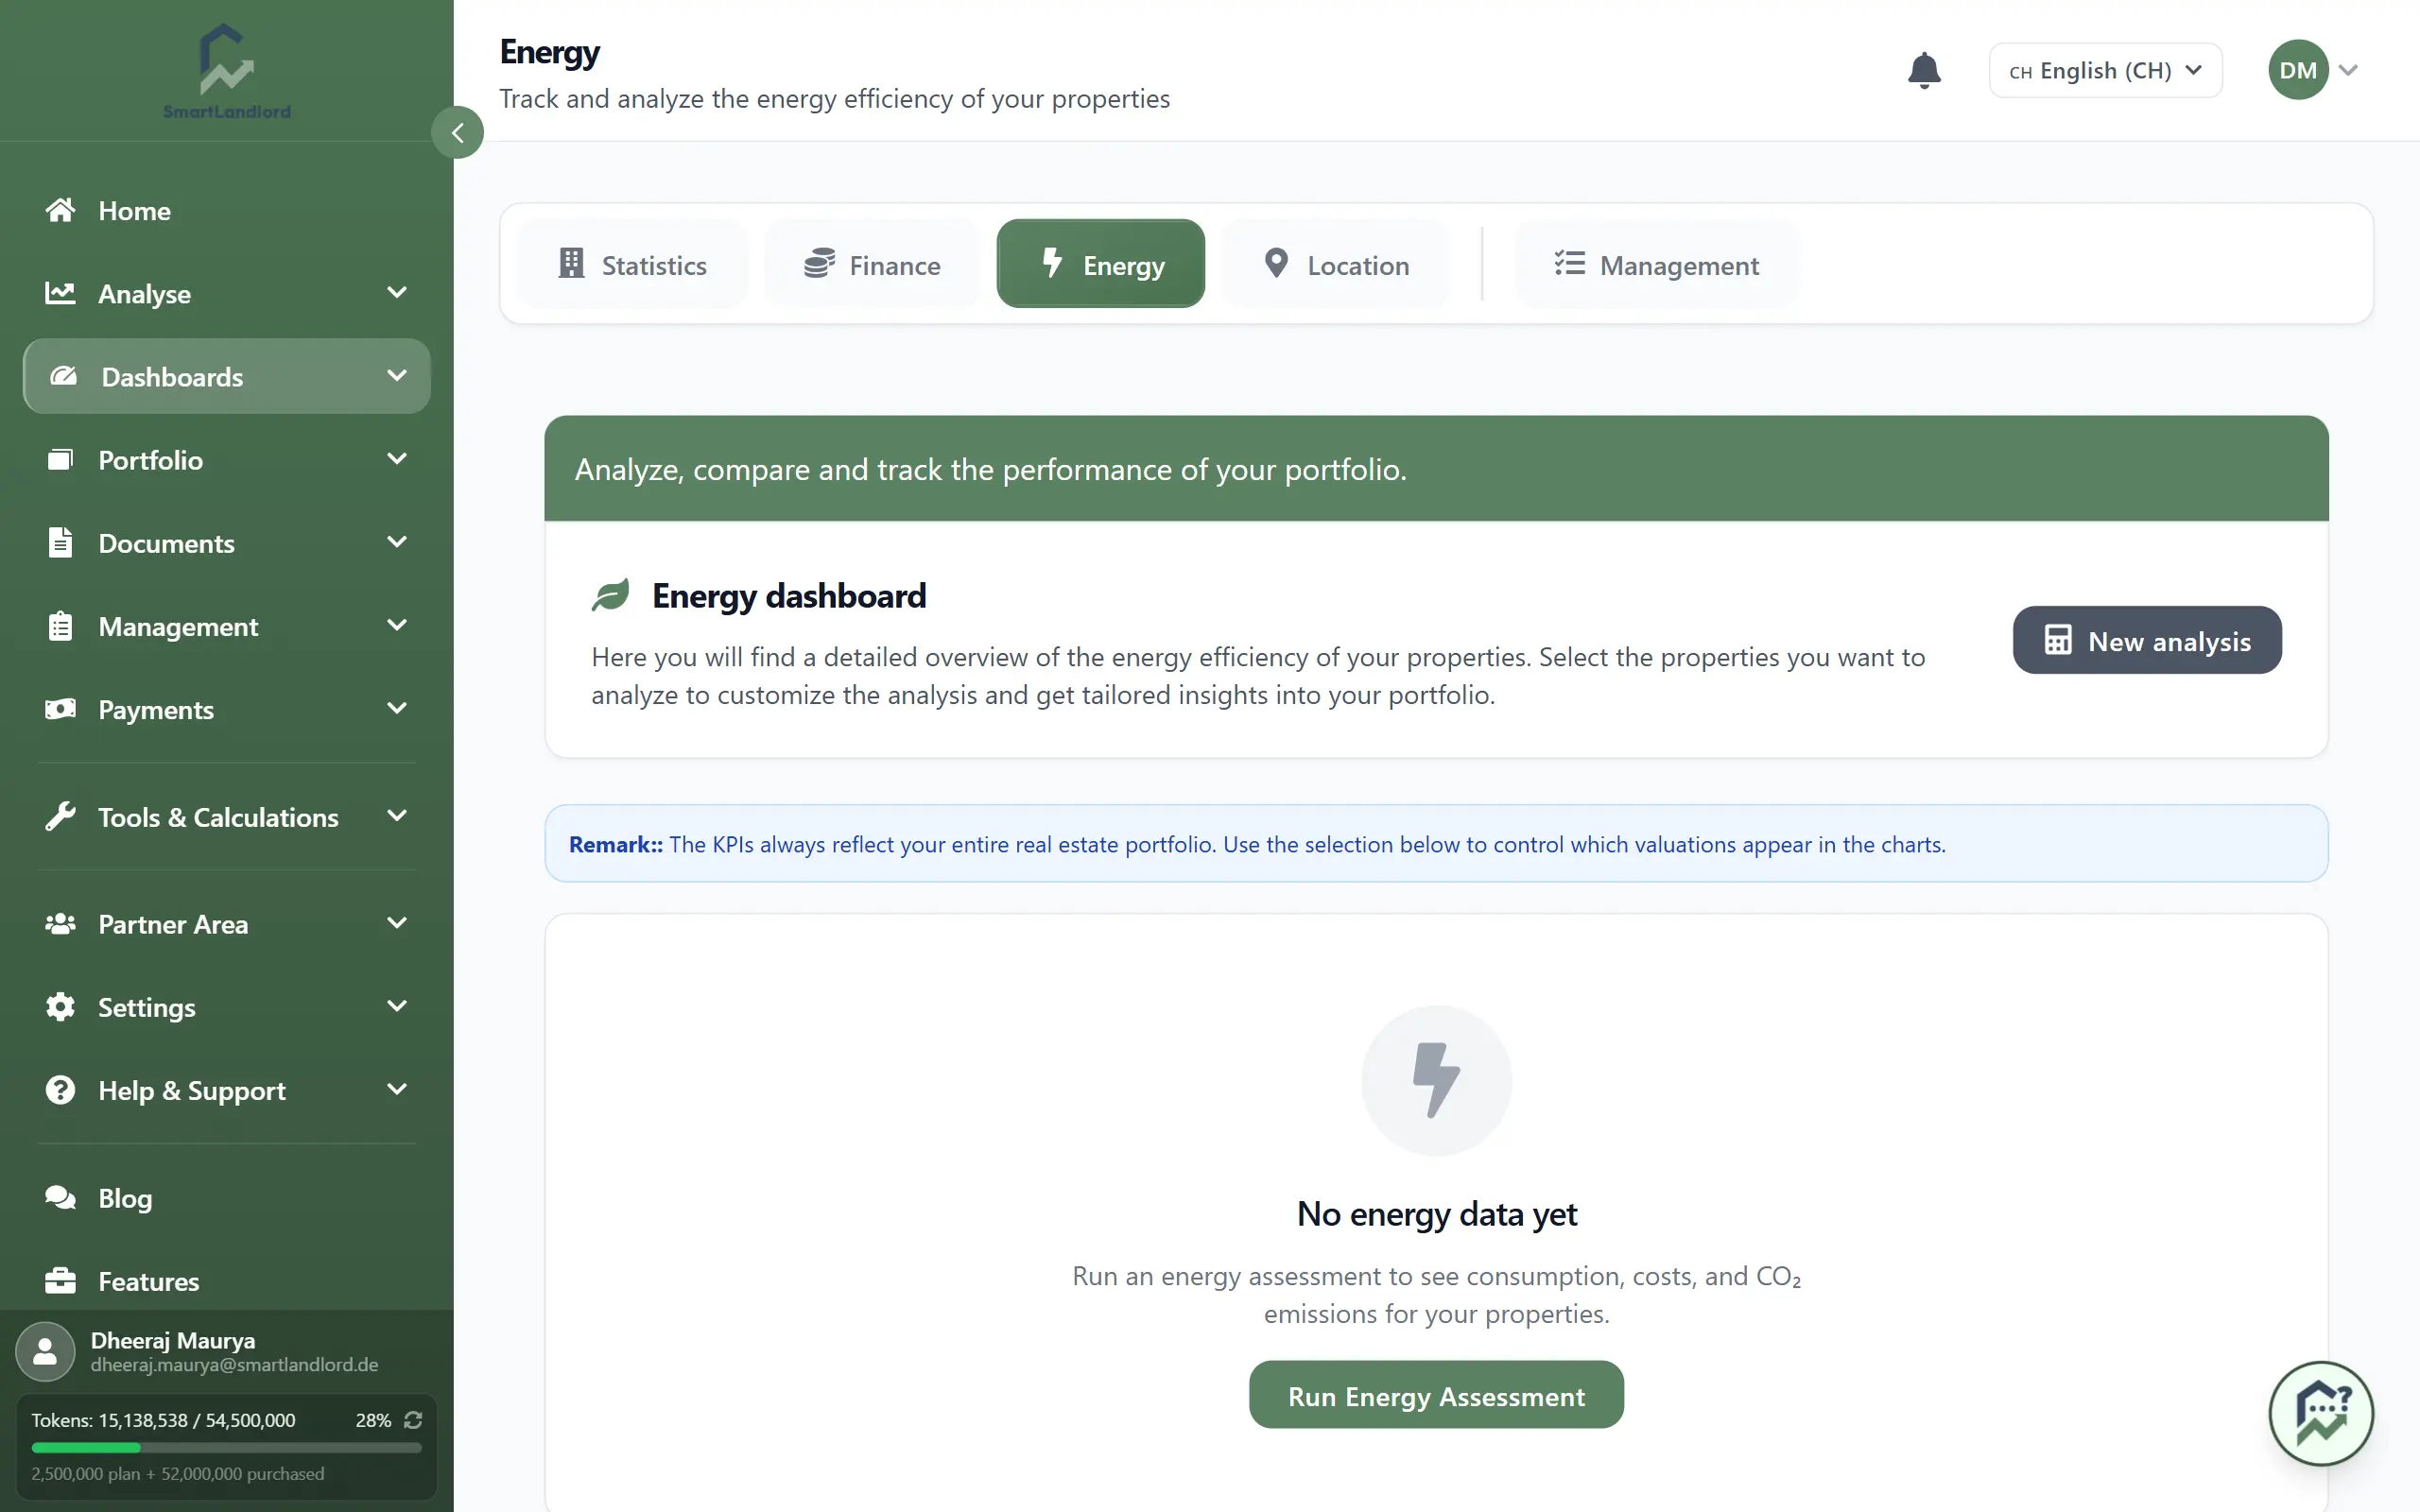
The Energie-dashboard provides a portfolio-wide view of the energy performance of your properties.
Open it under Dashboards → Energie-dashboard.
The dashboard uses data from your completed EnergyCheck assessments. If assessments are outdated or incomplete, the dashboard results may not accurately reflect current property performance.
What you see
The dashboard is organized into sections that help you understand the overall energy performance of your portfolio.
Portefeuille KPI's
This section displays the most important energy-related metrics across all included properties.
Typical metrics include:
- Total energy consumption.
- Heating costs.
- CO₂ emissions.
- Overall energy efficiency.
- Estimated savings potential.
These indicators provide a quick summary of how efficiently your portfolio is performing and where improvements may have the greatest impact.
Portfolio-overzicht
The portfolio overview displays the results of your energy assessments in a single table.
This allows you to:
- Compare properties side by side.
- Review energy performance across the portfolio.
- Sort and filter assessment results.
- Identify properties with higher energy consumption or operating costs.
Use the overview to identify properties with unusually high consumption, heating costs, or poor efficiency ratings before planning improvement projects.
Grafieken
The charts section presents energy data in a visual format.
Depending on the available data, charts may help you compare:
- Energy efficiency classes.
- Energy consumption.
- Heating costs.
- CO₂ emissions.
- Potential savings opportunities.
Visual comparisons make it easier to spot trends and identify properties that require further attention.
PDF export
The dashboard includes a PDF export option that allows you to generate a report of the displayed energy information.
This can be useful for:
- Internal reporting.
- Sharing results with partners or property owners.
- Tracking energy improvements over time.
- Maintaining documentation for future reference.
Export reports periodically if you want to maintain a historical record of energy performance and improvement progress.
Best practices
- Run EnergyCheck assessments regularly to keep dashboard data up to date.
- Review properties with high energy consumption or heating costs first.
- Compare efficiency ratings across similar properties.
- Use the dashboard to identify opportunities for modernization and energy savings.
- Export reports periodically to maintain a record of portfolio performance.
The quality of dashboard insights depends on the quality and freshness of the underlying energy assessment data.
The Energie-dashboard helps you monitor energy performance across your entire portfolio and quickly identify properties with the greatest potential for efficiency improvements.
Keeping dashboard data current
The information displayed in the energy dashboard is based on completed EnergyCheck assessments.
To ensure the dashboard reflects the latest available information:
- Update energy consumption data when new information becomes available.
- Run new energy assessments after significant property changes.
- Review assessment results periodically.
- Generate updated reports when required.
Keeping assessment data current helps ensure that the dashboard continues to reflect the latest available results.
Reviewing dashboard information
The dashboard is designed to provide a consolidated view of energy-related information across your portfolio.
When reviewing the dashboard, pay attention to:
- Properties with higher energy consumption.
- Properties with higher heating costs.
- Properties with lower efficiency ratings.
- Changes in portfolio-wide metrics over time.
Regular reviews can help you better understand the energy characteristics of your properties and identify areas that may require further investigation.
Using exported reports
The PDF export provides a snapshot of the information currently displayed in the dashboard.
Exported reports can be saved and reviewed later when comparing assessment results or tracking changes in portfolio energy data.
If assessment data changes, generate a new export so the report reflects the latest available information.