Real Estate Dashboard — Portfolio Statistics and Analysis
Use this dashboard to analyze how your portfolio is performing across all properties in one place.
The portfolio statistics section helps you understand returns, cashflow, diversification, and overall portfolio performance using aggregated data from your selected properties.
Opening the portfolio statistics
To open the portfolio statistics dashboard:
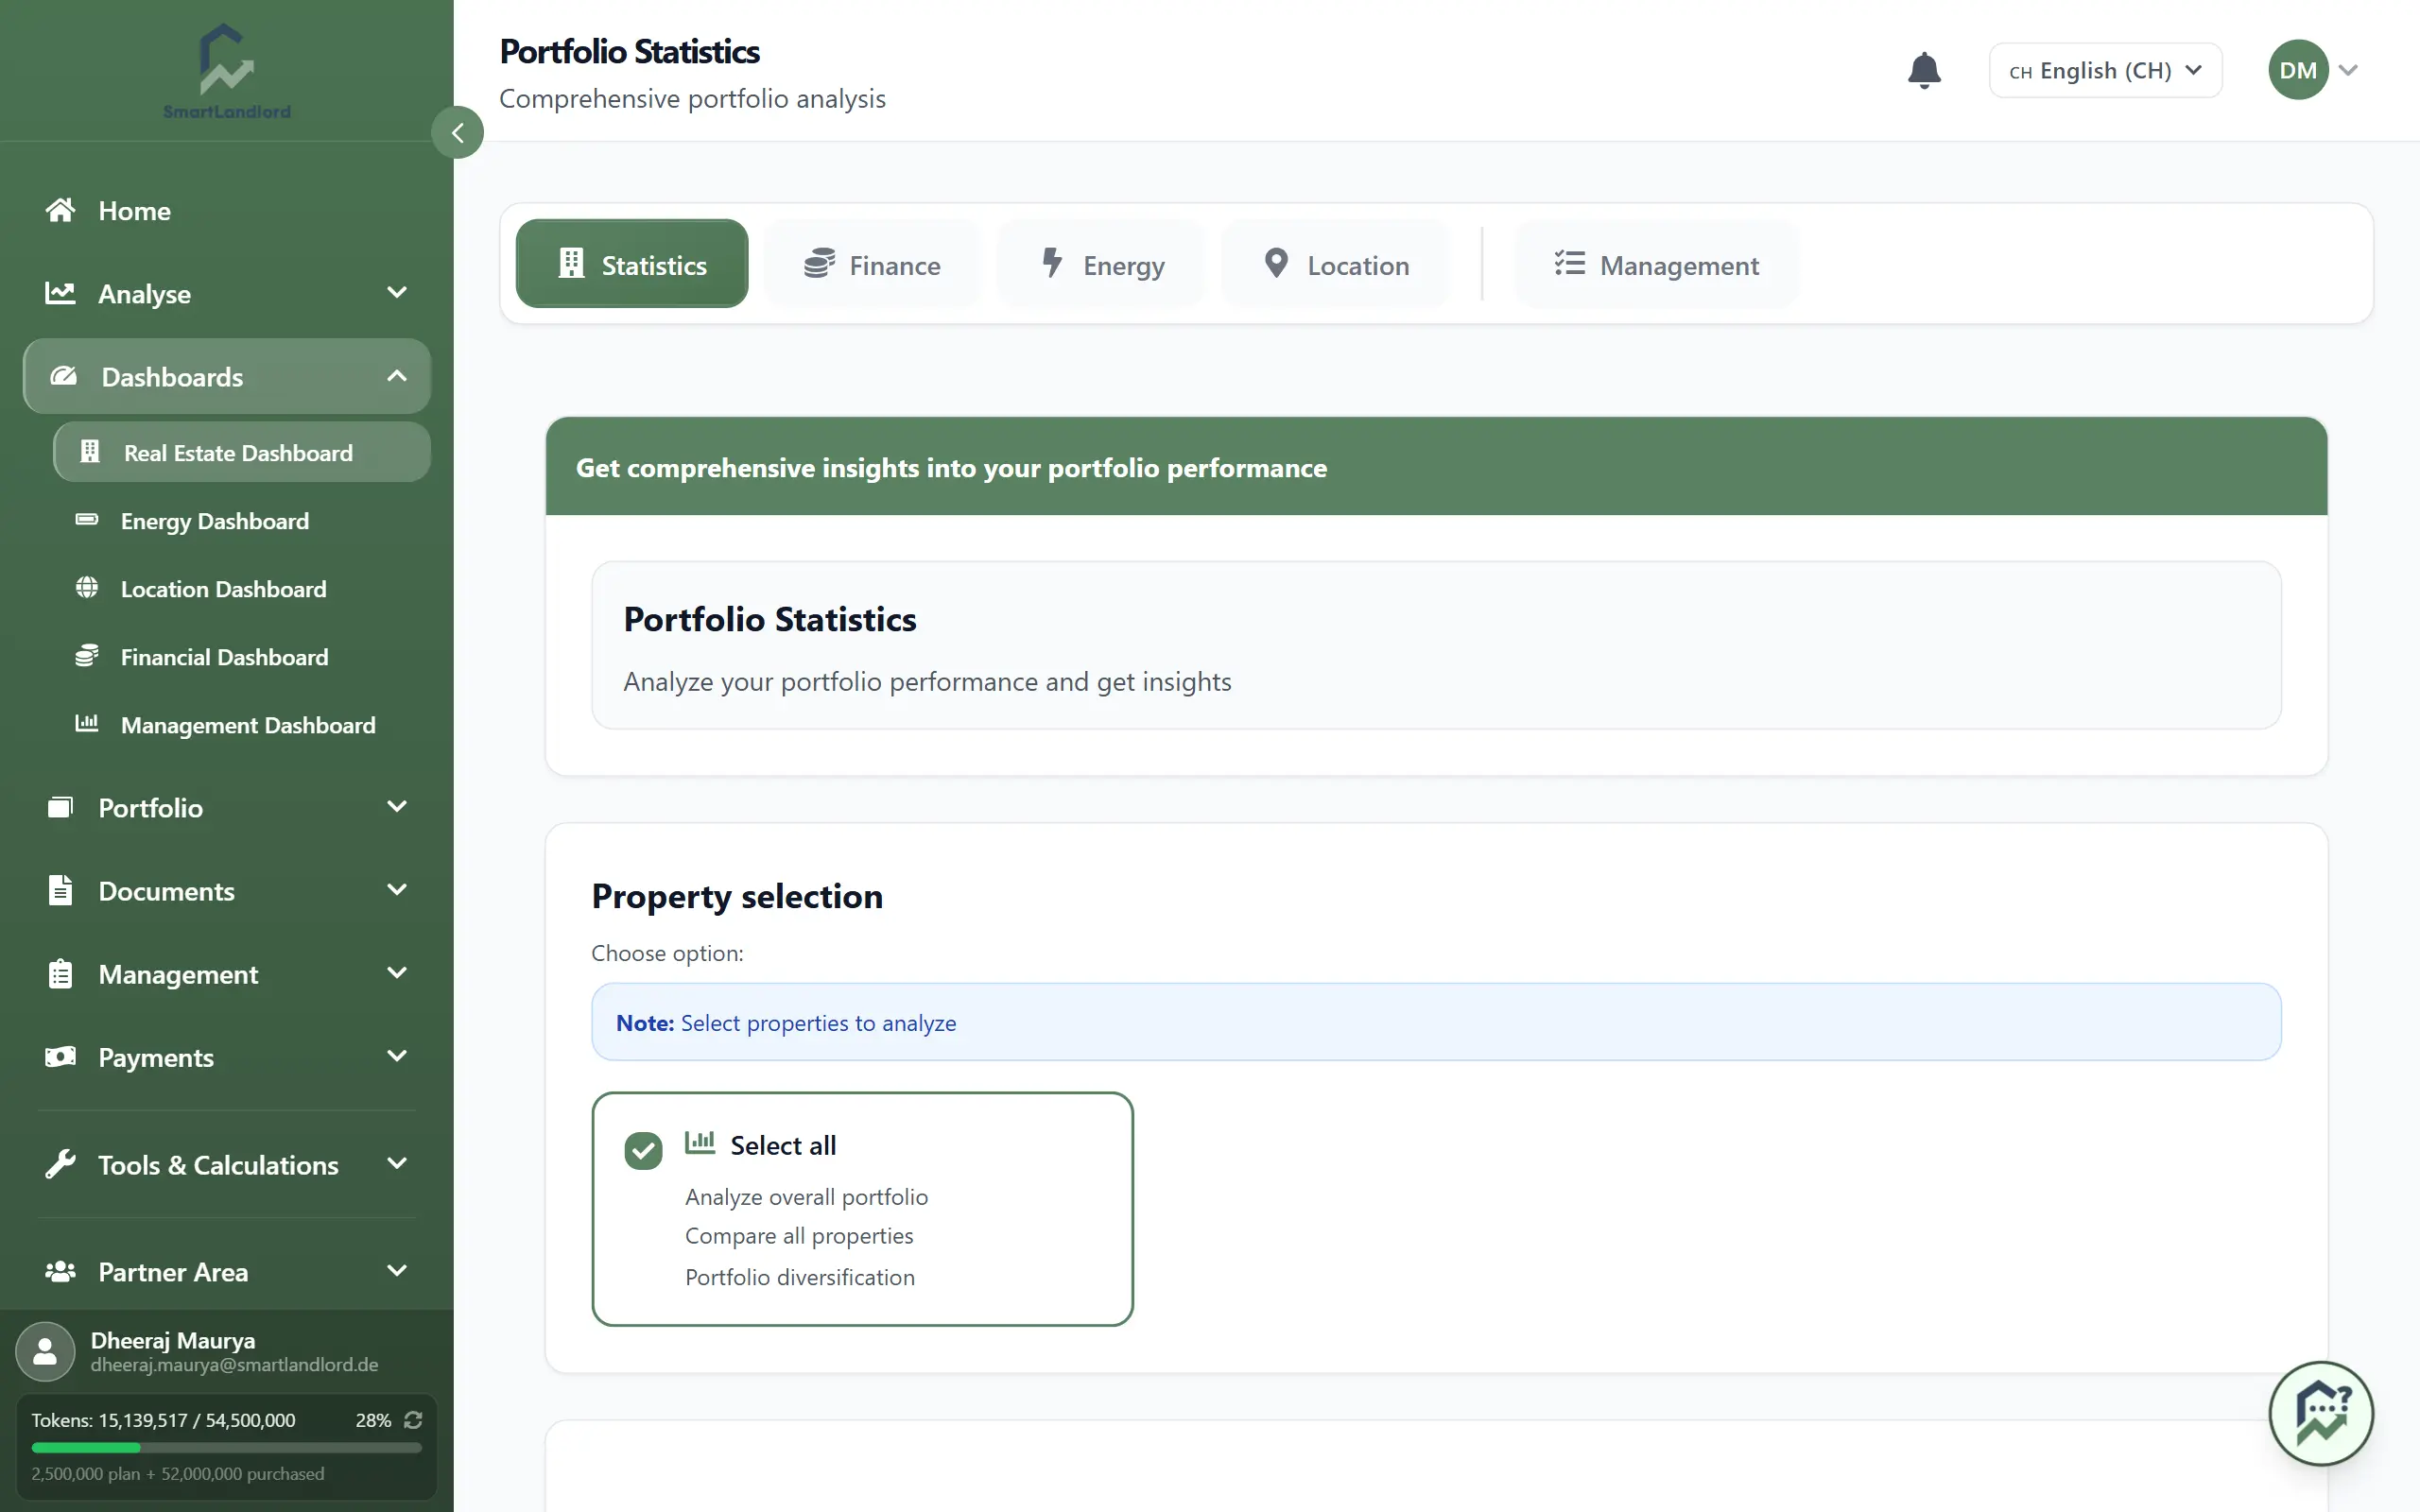
1. Go to the main sidebar.
2. Click Dashboards.
3. Select Vastgoed-dashboard.
4. Open Portefeuillestatistieken if it is not already active.
The dashboard loads the latest portfolio data based on the currently selected filters.
Choosing which properties to include
You can customize which properties are included in the analysis.
Available filters may include:
- Individual property selection.
- Property groups or categories.
- Location-based filters.
- Ownership-based filters.
- Date range selection.
Changing filters updates the dashboard automatically and allows you to compare different portfolio segments.
The dashboard only analyzes the properties included in the selected filters. Always verify your filter settings before reviewing results or exporting reports.
Key figures
The Belangrijke cijfers section provides a quick overview of your portfolio performance.
Yield
Shows how much income your portfolio generates relative to the invested capital.
Multiplier
Indicates how your portfolio value has developed compared to the original investment.
For example:
- 1.0× = no growth
- 1.2× = 20% growth
- 1.5× = 50% growth
Return
Summarizes the overall performance of your portfolio by combining income and value development for the selected period.
These figures help you evaluate portfolio performance without reviewing individual properties one by one.
Yield, multiplier, and return should be reviewed together to get a complete picture of portfolio performance.
Cashflow and performance rankings
The dashboard includes sections that help identify strong and weak performers within your portfolio.
Cashflow-vergelijking — alle panden
Compare income and expenses across properties or time periods.
Typical categories include:
- Rental income
- Additional income
- Operating expenses
- Maintenance costs
- Financing costs
This helps you understand where cashflow is generated and where costs are highest.
Prestatieklassementen
Ranks properties according to important performance metrics.
Depending on your configuration, rankings may include:
- Yield
- Return
- Cashflow
- Property value growth
Use performance rankings to identify both top-performing and underperforming properties that may require further review.
Use these rankings to identify top-performing and underperforming assets.
Diversification and risk
Understanding portfolio concentration is important when managing risk.
Portefeuillediversificatie
Shows how your portfolio is distributed across categories such as:
- City
- Region
- Property type
- Tenant mix
This helps identify whether your investments are overly concentrated in a single area.
High concentration in a single region, property type, or tenant group may increase portfolio risk.
Break-even analyse
Shows the occupancy or rental income level required to cover all portfolio costs.
This helps you understand how much buffer exists before the portfolio becomes unprofitable.
Kostenstructuur
Provides a breakdown of major expense categories such as:
- Operating costs
- Maintenance costs
- Financing expenses
- Other recurring costs
Reviewing cost structure can help identify opportunities to improve profitability.
Diagrams and PDF export
The Diagrammen section provides visual representations of your portfolio data.
You can use diagrams to:
- Analyze performance trends over time.
- Compare properties or categories.
- Review cashflow distribution.
- Understand diversification across different segments.
Hover over chart elements to view detailed values and comparisons.
If available, use the PDF export option to generate a report containing key figures, charts, and portfolio statistics for the currently selected filters.
Verify your selected filters before exporting a PDF to ensure the report contains the properties and data you intend to analyze.
The exported report can be used for internal reviews, investor updates, or long-term record keeping.