Location Dashboard — Analyze and Compare Property Locations
The Locatie-dashboard collects all your location assessments in one place. Open it under Dashboards → Locatie-dashboard.
Its numbers come from the LocationCheck assessments you have run.
The dashboard only reflects completed location assessments. If assessments are outdated or missing, the dashboard may not accurately represent your portfolio.
Use this dashboard to compare locations across your portfolio and spot strong or weak areas at a glance.
1. What you see
The location dashboard shows three main sections:
- Kerncijfers (KPI's) – summary numbers.
- Overzicht locatie – a table of all assessments.
- Grafieken – visual score comparisons.
The dashboard combines completed location assessments into a single view, making it easier to review assessment results without opening each report individually.
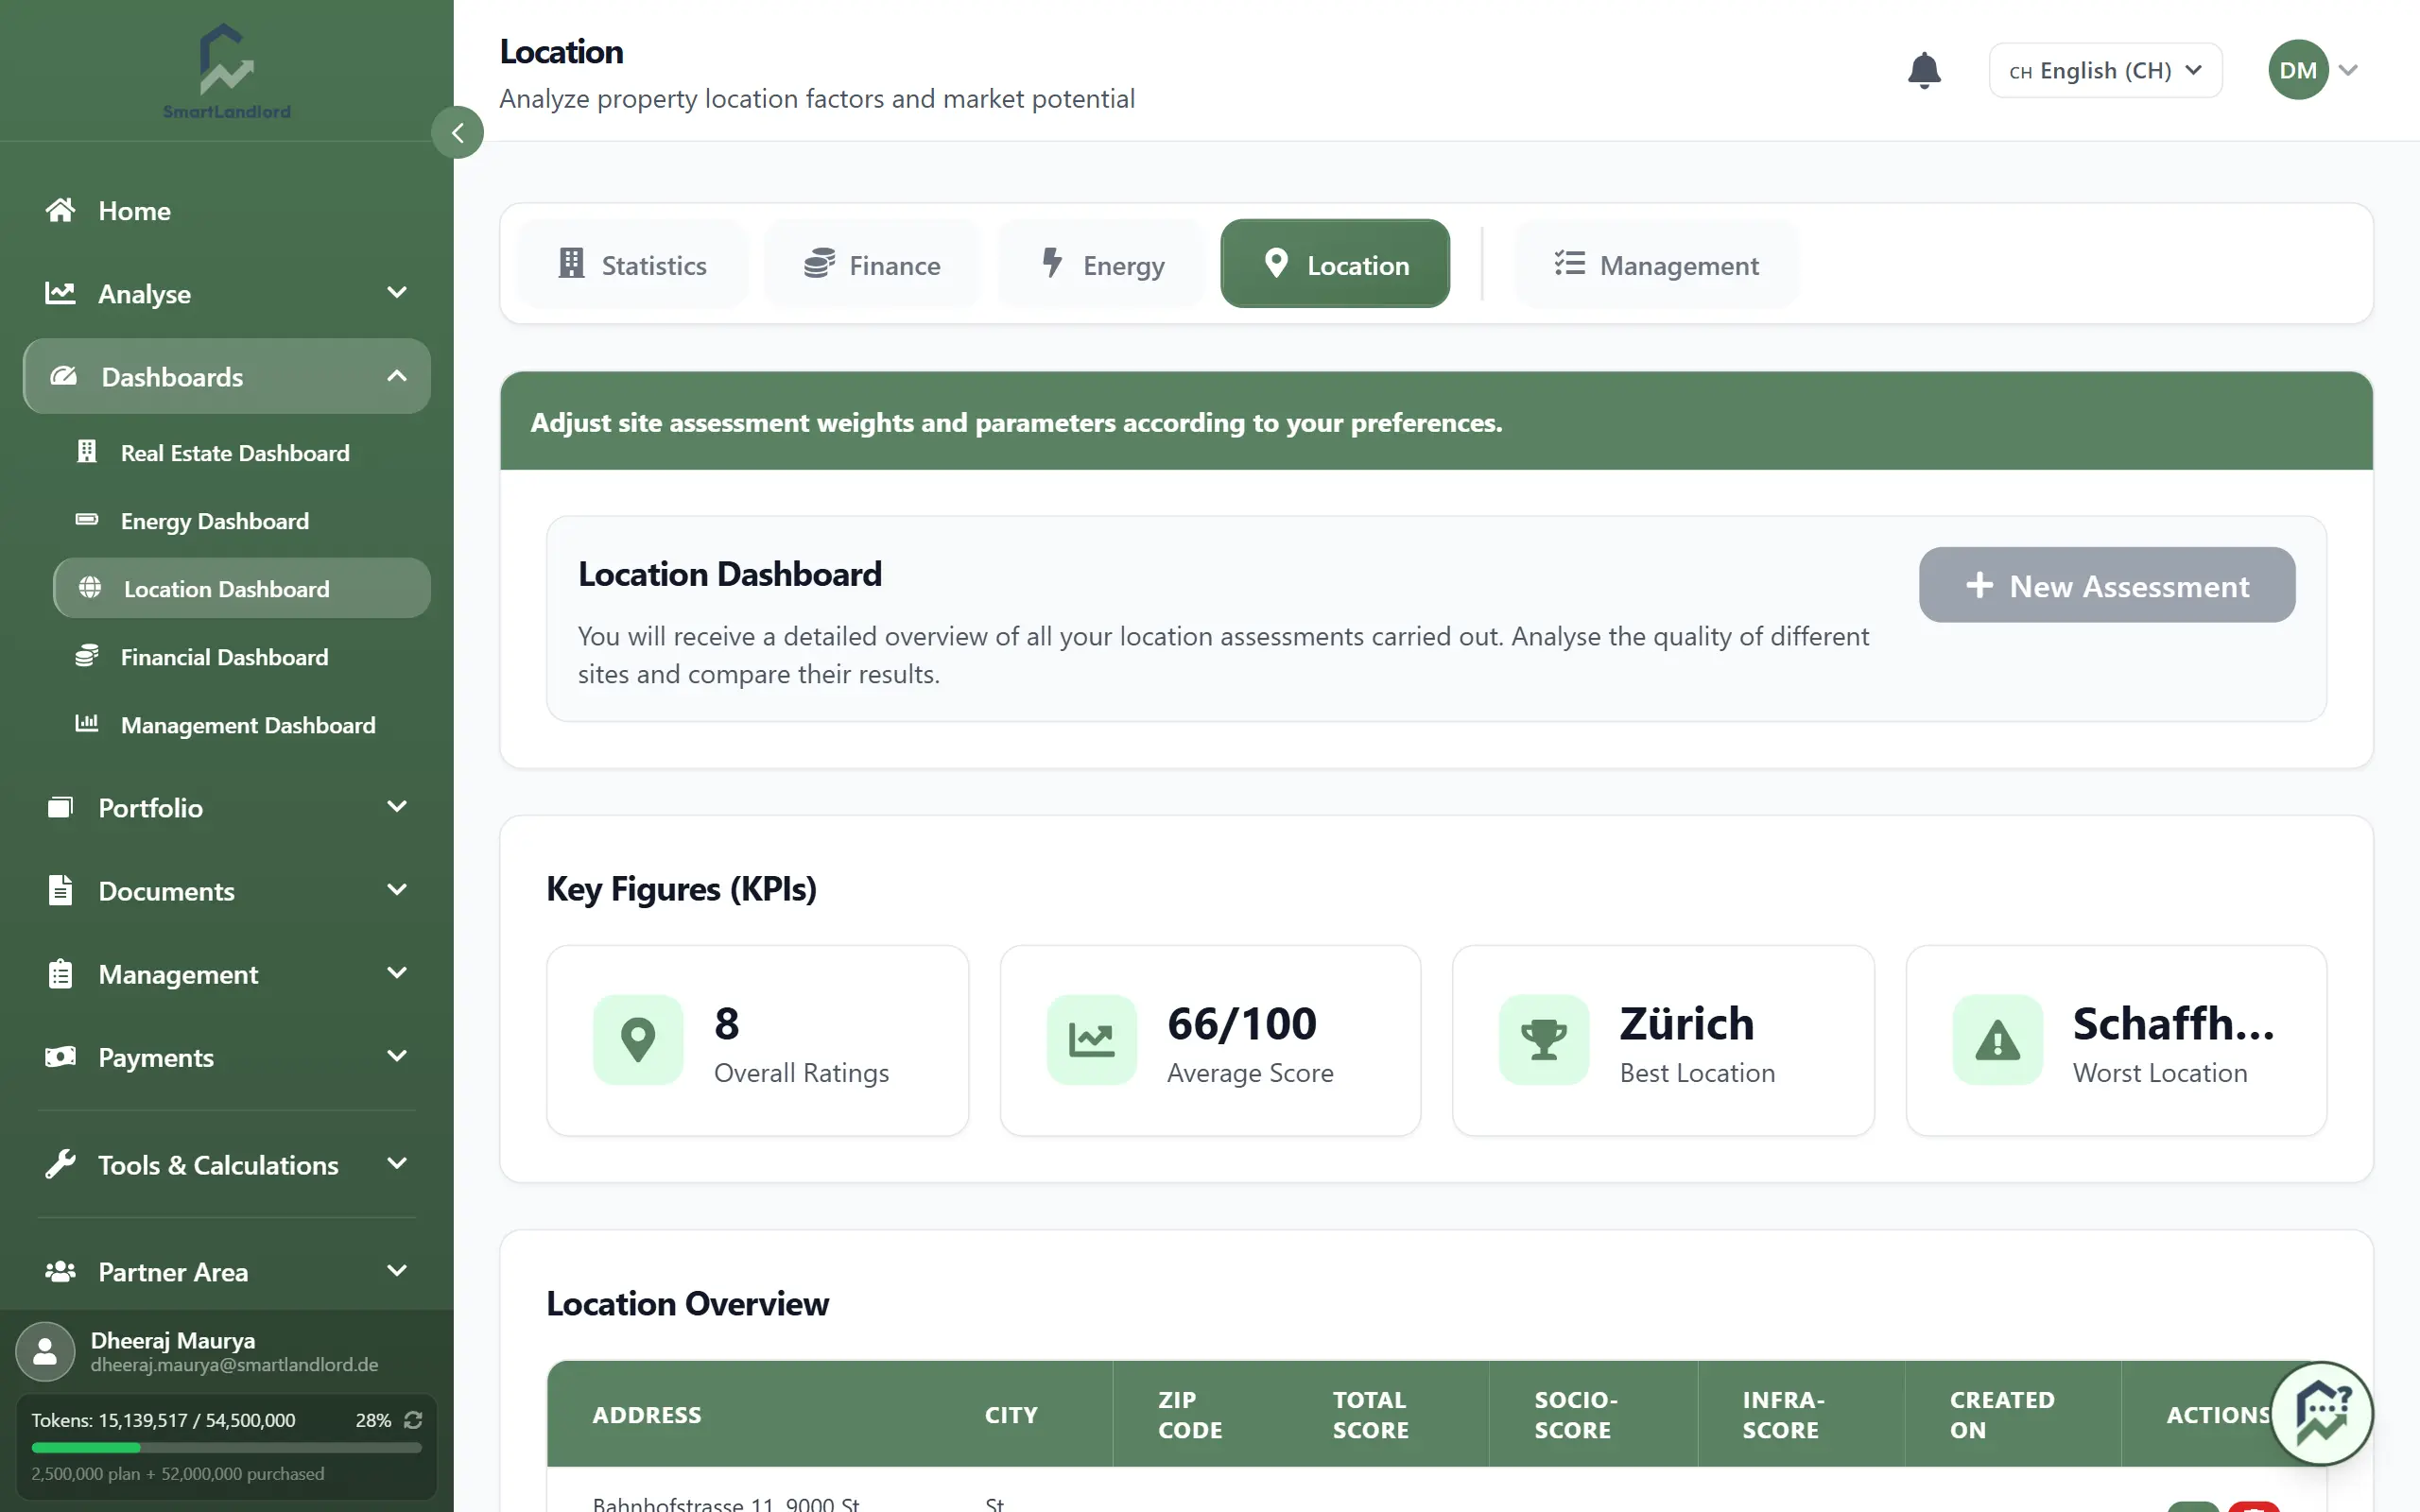
2. Kerncijfers (KPI's)
The key figures section gives you a quick overview of your portfolio’s location quality.
It typically shows:
- Number of assessments – how many location checks you have run.
- Gemiddelde score – the average location score across all assessments.
- Beste locatie – the assessment with the highest score.
- Slechtste locatie – the assessment with the lowest score.
Use these numbers to understand whether your portfolio is generally in strong locations, and to identify outliers that may need attention.
Use the average score, best location, and worst location as indicators only. Always review the detailed assessment results before making investment decisions.
The key figures section is often the fastest way to review overall assessment results and understand how location quality varies across your portfolio.
3. Overzicht locatie
The location overview is a table listing every location assessment.
Each row usually shows:
- Property or address name.
- Overall location score.
- Date of the assessment.
- Key breakdowns (for example, infrastructure or socio-economic indicators), depending on your setup.
You can use this table to:
- Compare scores across properties.
- Sort by score to find your best and worst locations.
- Identify assessments that are old or missing.
Regularly review older assessments and consider running a new location assessment if market conditions or local developments may have changed.
Reviewing the overview regularly can help you keep track of which properties have already been assessed and which locations may require additional review.
4. Grafieken
The charts section shows visual comparisons of your location scores.
You may see:
- A bar chart comparing scores by property.
- A distribution chart (for example, how many properties fall into different score ranges).
- Optional comparisons of infrastructure or socio-economic sub-scores.
Use charts to quickly see patterns, such as:
- Clusters of high-scoring or low-scoring locations.
- Outliers that stand out from the average.
- Differences between sub-categories (for example, infrastructure vs socio-economic).
Charts help identify trends and outliers, but detailed assessment reports provide the context needed to understand why scores differ.
Visual summaries can make it easier to identify patterns that may be less obvious when reviewing individual assessment reports.
5. Reviewing dashboard information
The dashboard is based on completed LocationCheck assessments.
When reviewing the dashboard, pay attention to:
- Locations with significantly higher scores.
- Locations with significantly lower scores.
- Differences between assessment results.
- Recently completed assessments.
Use the dashboard to identify locations that require further investigation, not as the sole basis for investment decisions.
Reviewing dashboard information regularly can help you maintain an overview of location assessment results across your portfolio.
6. Tips
- Run new location checks in LocationCheck to keep the dashboard up to date.
- Use the dashboard when you are comparing multiple properties or planning where to invest next.
- Combine location scores with your financial analysis and property condition before making major decisions.
- Review detailed assessment reports when you need more information about a specific location.
The strongest investment decisions combine location assessment results with financial analysis, property condition, market research, and local expertise.
The Locatie-dashboard provides a consolidated view of your location assessment results and helps you review location information across your portfolio.